These pages have been developed for the ‘Girls' Day 2021’ – an outreach event for pupils – by Iris Feldt, Christophe Pixius, Johannes Schwinn, Jiahan Shi, Sofía Vidal, Ricardo Waibel and Martina Zündel. In this context, also this video was created, which explains the work in our group.
The cosmic microwave background and spherical harmonics
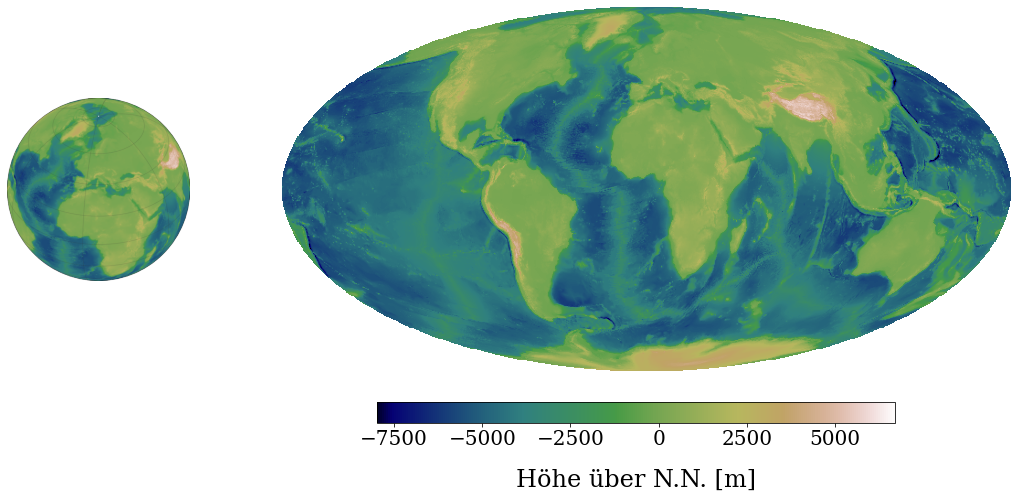
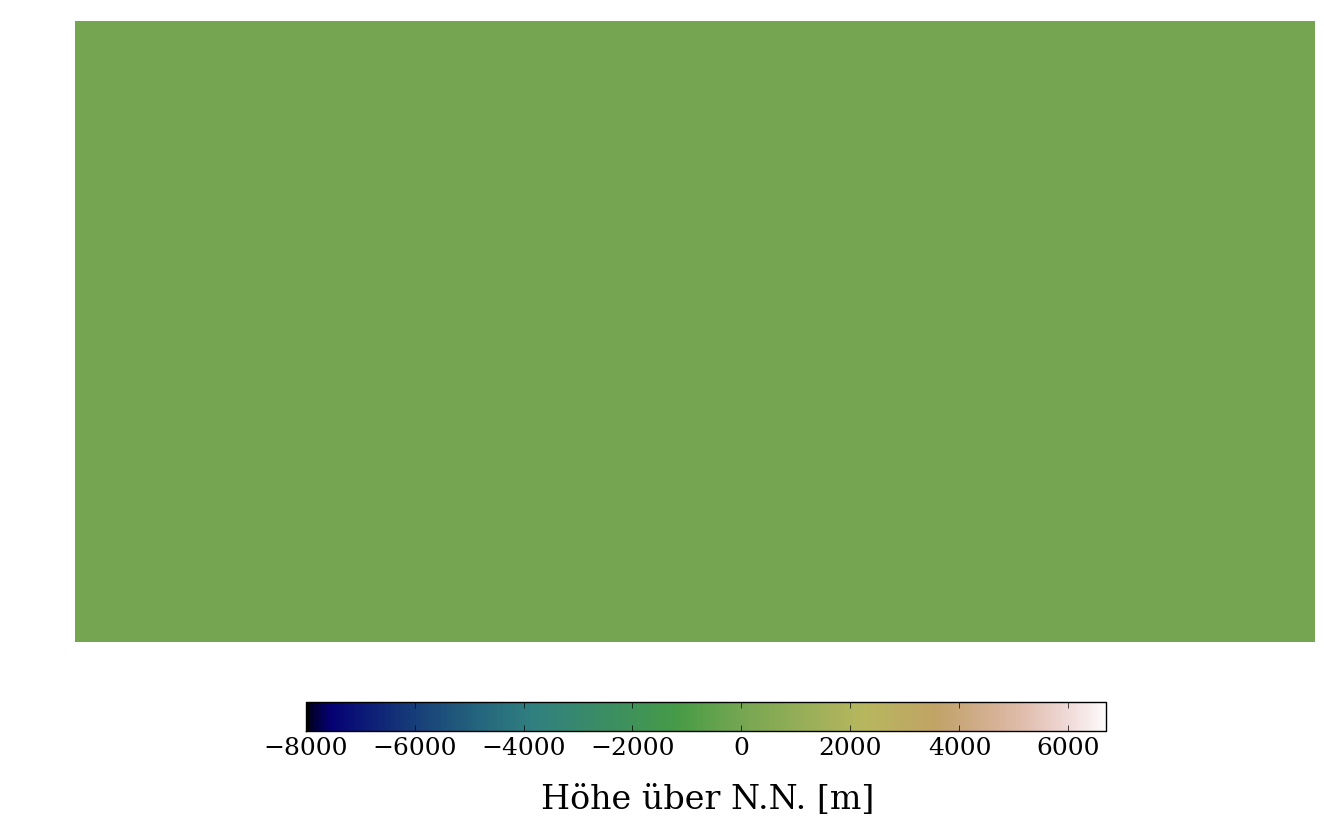
1) Map of the Earth
Here you can see on the right-hand side a map of the Earth. The colours represent the altitude above sea level in metres m>
.
Some of the regions have negative values – what does this mean?
Are you surprised by the figure?
What would happen, if one crossed the right edge of the map?
2) Reconstruct the altitudes of the Earth surface
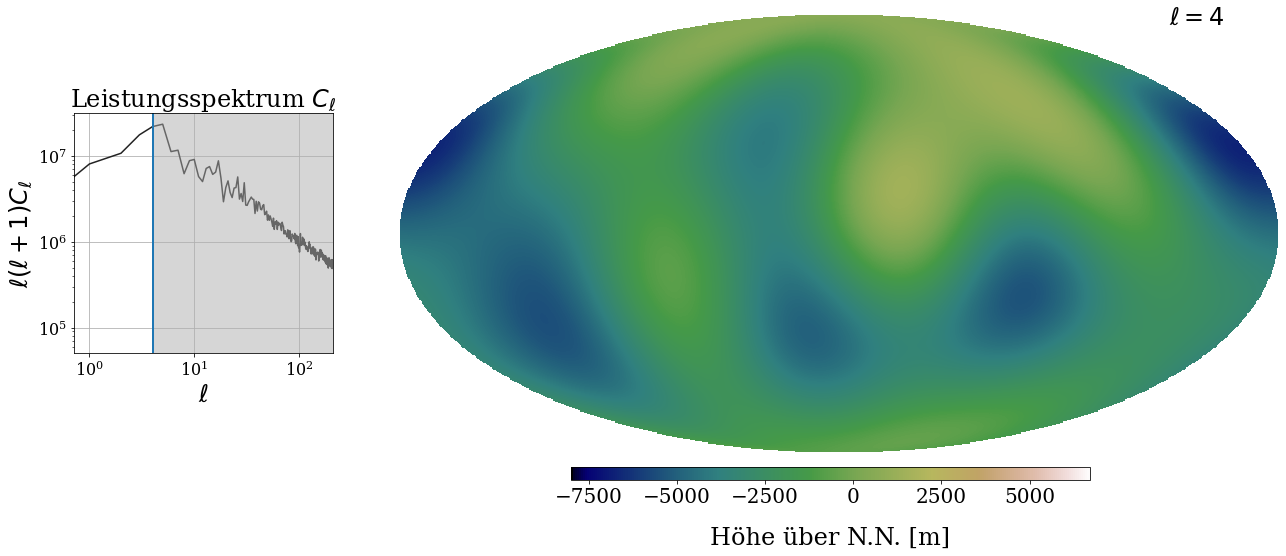
On the right-hand side you can see once again a map of the Earth – at least if you drag the slider all the way to the right.
How does the image of the Earth change, when you change the value of ℓ to smaller or larger values?
What is the role of the ℓ?
You can see a so-called ‘power spectrum’ on the left-hand side. Such power spectra are also used in cosmology. The white part of the plot marks the range of ℓ that has been used for reconstructing the map of the Earth on the right-hand side. All scales higher than the ℓ you have set are ignored and thus marked by the grey region. The more information we use, that means the more scales we take into account for reconstructing the map of the Earth’s altitudes, the more precise we can reproduce the original image.
3) How does the reconstruction work? What is the role of ℓ?
In the following figure, you can see so-called ‘spherical harmonics’. These 2d-functions are used as basis functions for the reconstruction of the original image. As you can see in the triangular figure below, there exist one or several different basis functions for each ℓ (see the rows). How many basis functions are there for ℓ=1? How do the patterns of the basis functions change when ℓ is increased?
In the last column on the right-hand side, you can see what happens when we weight all basis functions up to this ℓ and add them toghether. By the way, with weighting we mean that we multiply the basis functions by a factor that is the heigher the more important this basis function is.
You see again, the more basis functions we take into account, the more precise the reconstruction can get.
… but where do we know the weighting factors of the basis functions from? (see part 3.b)
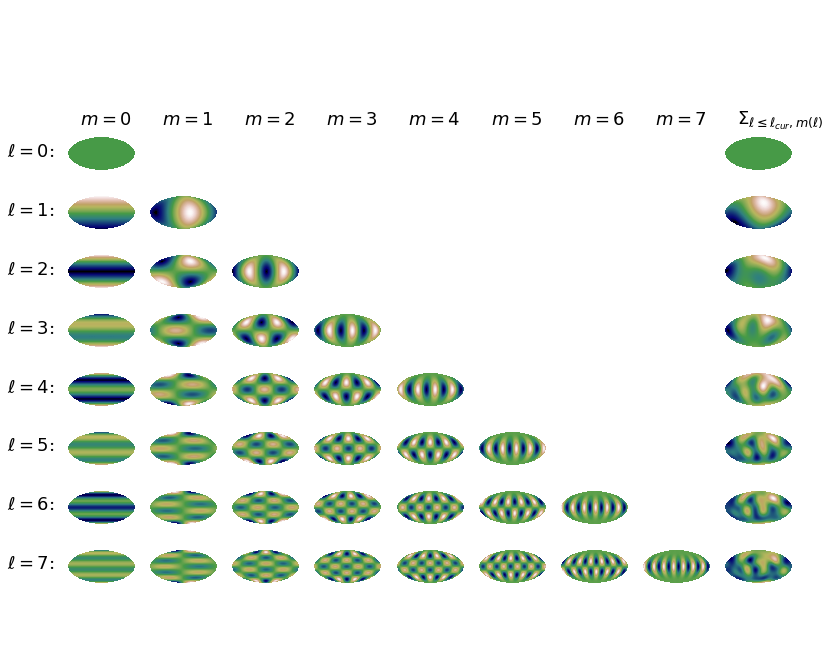
Here you can select yourself which basis functions you would like to add and how that changes the image. The functions are already multiplied by the correct weighting factor.
3b) Where do we know the weighting factors from?
First of all, we ask ourselves the following question: Why do we actually need functions that are two-dimensional? Do you understand why they are called spherical harmonics? Why the ‘spherical’ and why the ‘harmonic’?
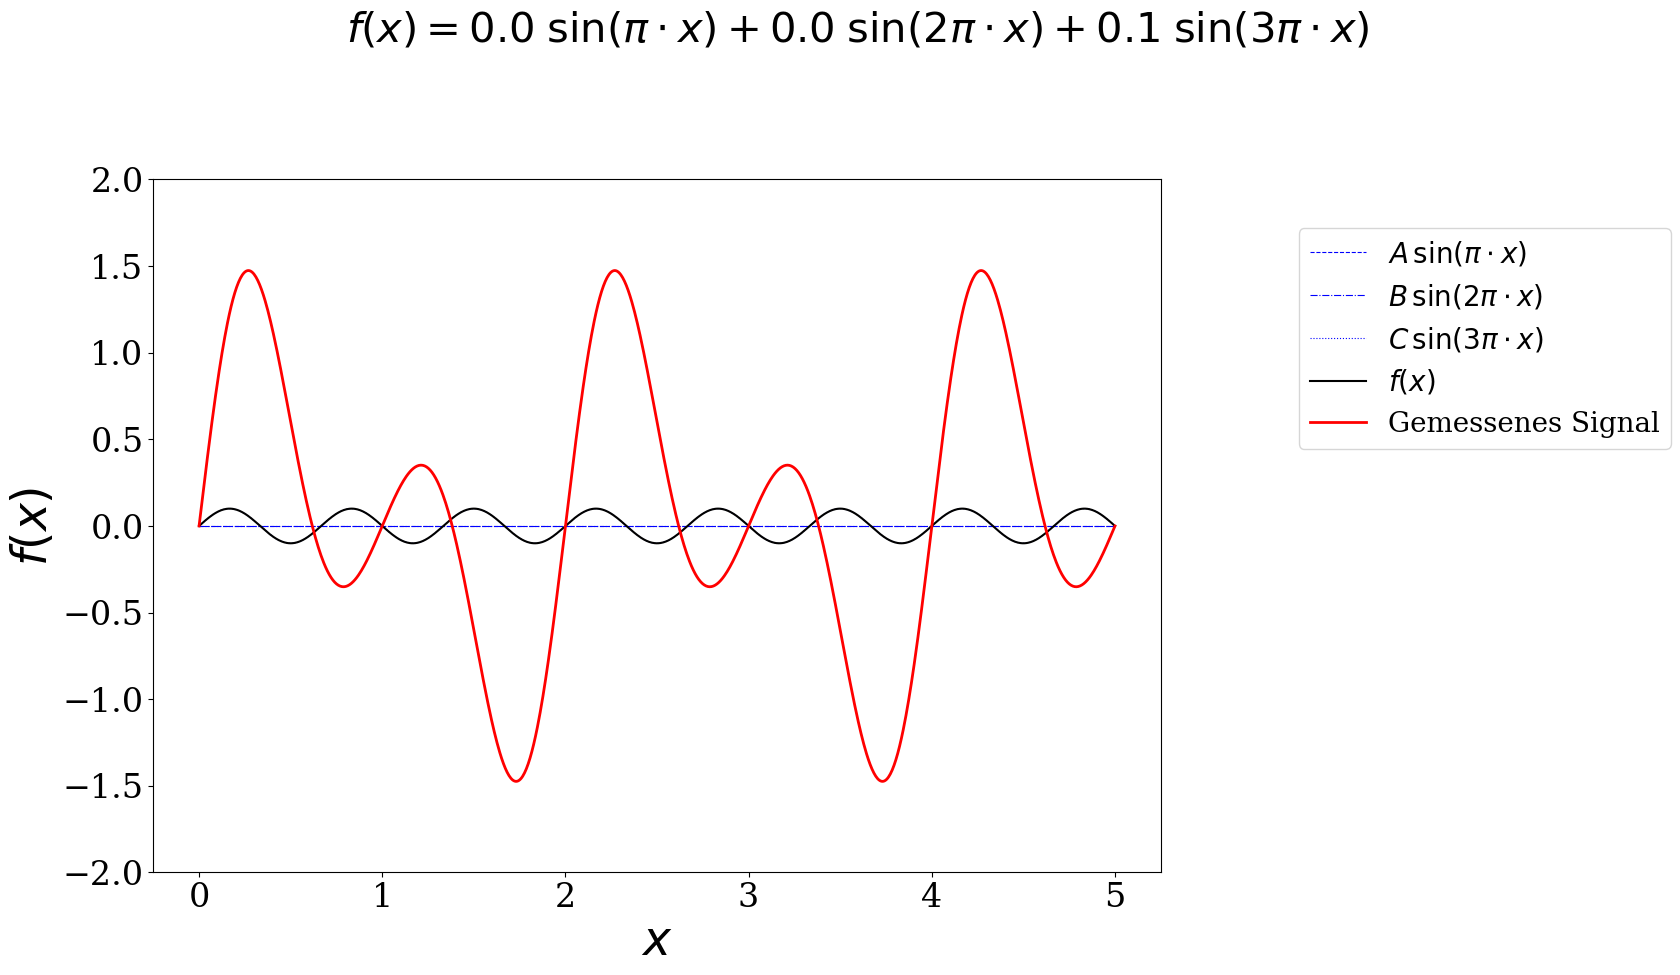
In order to understand how to obtain the weighting factors, we consider first a simpler case: A one-dimensional signal. It could look for example like the red line in the plot below. The blue functions are in this game the basis functions. They can be multiplied by the amplitudes (or weighting factors) A, B, C and added. The sum results in the black curve. Can you adjust the prefactors such that the black curve reproduces the ‘measured’ red signal?
A:
B:
C: