

The cosmic microwave background and spherical harmonics
4) The cosmic microwave background
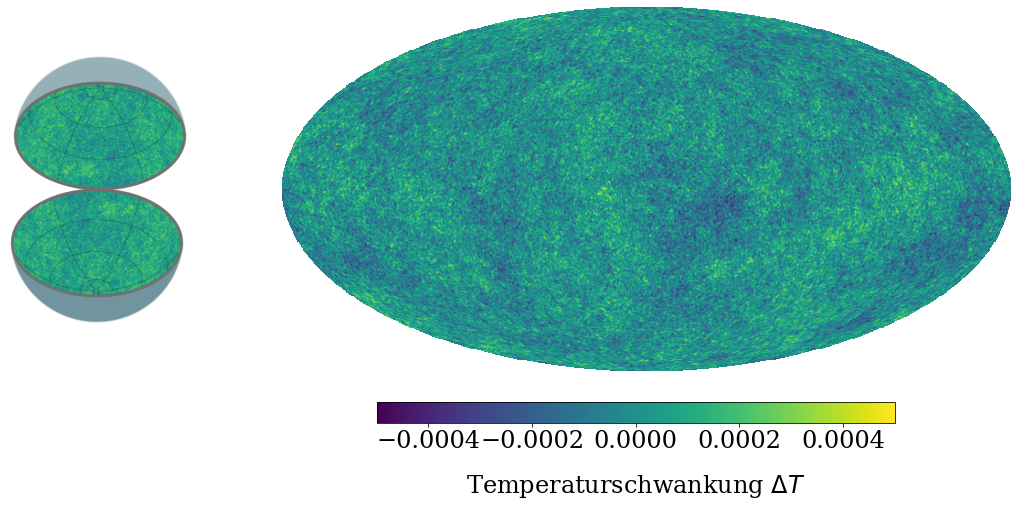
The cosmic microwave background (CMB) is radiation that reaches our planet Earth from all sides.
On the left-hand side, you can see an illustration of this radiation how it appears on the sky. You can imagine the Earth being located in the centre of the sphere. If we observe the full sky surrounding us, we can create a two-dimensional map, which represents the microwave sky – lust like we created the map of the Earth’s surface.
On the right-hand side, you can see this map: the colours represent the temperature fluctuations Δ𝑇 . They reach from approximately −0.0005 K to +0.0005 K and are given in units of Kelvin (K). The temperatures fluctuate around a mean value of 2.73 K.
How small are the fluctuations in comparison to the mean value?
Can you see patterns in the image? No? We cannot either by bare eye ...
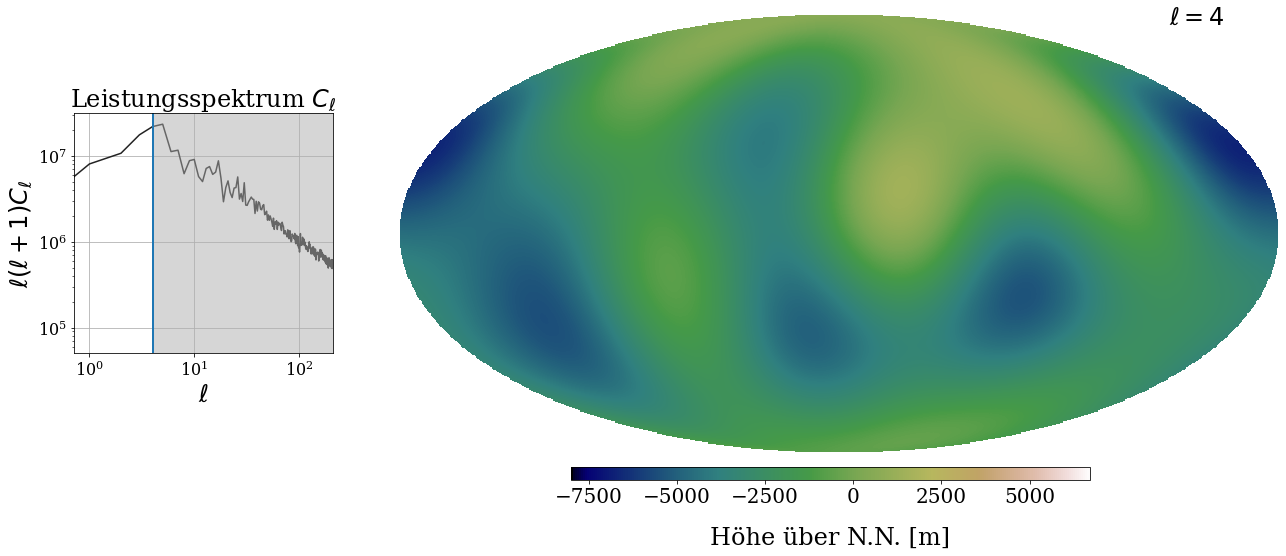
Here you can reconstruct again a map – in this case the map of the CMB – by using spherical harmonics by using the slider for changing ℓ. The higher ℓ gets the more basis functions weighted by the according factors you are adding. Thus, the image gets more and more precise.
On the left-hand side you can see the power spectrum. However, no it looks completely different in comparison with that of the Earth! It shows the prefactors corresponding to the respective basis function. When you use the slider for changing ℓ, you can see that more or less basis functions are used to reconstruct the image as indicated by the white region.
The more prefactors we can determine from the measured signal of the CMB the better we can reconstruct reality. This means therefore that we have more information about the Universe and can compare our theoretical predictions better with the observations. You can see an example in part 5.
5) What is the fraction of atoms in the Universe?
The Universe contains dark matter and visible matter. The latter consists almost completely of atoms, that means ‘something we know what it is’. With dark matter, however, we do not know what it is – just that it is there. One of the reasons, why we know that it is there, is shown below.
We can calculate how the power spectrum of the CMB should look like according to our model of the Universe. But the exact shape of the power spectrum depends on the fraction of atoms on the total matter in the Universe. For this reason, we can compare the predicted power spectrum with the observations. This allows us to determine this quantity.
You can see in the figure below how the observed power spectrum looks like, which is shown by the red line. By the use of the slider, you can change the fraction of atoms in the Universe. The black line then shows what our model would predict for the corresponding power spectrum.
When is our model matching the observed power spectrum?
Can you find out what the fraction of atoms in the Universe is?
Sources: The used data of the earth was taken from the ETOPO5-Project, the CMB data from ESA and the Planck-Collaboration. The graphics were generated with python, mainly with the the libraries matplotlib, healpy, cartopy, astropy, and camb.